HM London 2016 Conference: Panel on Michael Roberts’s The Long Depression
Michael Roberts is a private researcher who has worked as an economist in the City of London for over 30 years. He is the author of The Great Recession – a Marxist View (2009, Lulu Press) and The Long Depression(2016, Haymarket Publications). He has presented papers to the American Economics Association annual conferences, Historical Materialism conferences and to those of International Initiative for the Promotion of Political Economy (IIPPE) and the Association of Heterodox Economists (AHE). He writes a blog on Marxist economics at thenextrecession.wordpress.com.
At the 13th annual HM Conference in Londonhm-13-16, I am participating in a session where I shall present the key ideas in my new book,The Long Depression. You can get a gist of those themes froma previous post. Also participating are Jim Kincaid, Al Campbell and Erdogan Bakir who will offer some short comments on my book and its conclusions.
For some time, Jim has wanted to present a critique of my empirical work on Marx’s law of the tendency of the rate of profit and my thesis that Marx’s law can be seen as the underlying cause of crises in modern capitalism and, in particular, of the Great Recession of 2008-9. “I have been able to assess more closely a dimension of Michael’s work which I believe is open to question. A central theme in much of his analysis is that it is a declining rate of profit which is the underlying cause of the sequence of crisis which has afflicted the major industrial economies since the late 1990s.”
Al Campbell will deliver his comments at the session, but before the session, Jim has posted on his own (very interesting) blog, an opening critique of my empirical work along with an alternative approach to the current crisis.
His alternative explanation runs along these lines (as in his post):“That the mass of profit has been relatively high in the last 10 years gives some support to the broader argument I have been developing that in this period the system has been contending, not with falling rates of realised profit, but rather with an excess of profit relative to the levels of investment which have been lagging.”
And thus Jim argues against my view that: “the crucial underlying cause of the crises of the post-2000 period is that the rate of profit peaked in 1997 and has not recovered since. Behind this is a logically questionable assumption, that if crises are recurrent (even though different in form) there must be a single and common cause.”
Jim goes on: “as Michael’s own empirical work makes evident, there has not been, over the past 20 years, a simple linear fall in the US rate of profit. Rather what we see are cyclical patterns of oscillation. Falling rate of profit tendencies are battling it out against counter-tendencies, with complex results which have to be explained dialectically and not by looking for a single unilinear cause.”
You can read Jim’s full critique, which is just an opening shot, on his blog. But the essence of my reply follows below. I apologise for the length of this post in advance, but both Jim and I thought it would be useful to post our opening thoughts before the HM session so others could consider the arguments.
Jim is very kind in praising much of my efforts on my blog and in the book to develop Marxist economic theory with empirical evidence. But I’ll concentrate on dealing with Jim’s critique of my work on the post-war profitability of capital in the US, its relation to Marx’s law of the tendency of the rate of profit to fall and the causes of crises under capitalism, particularly the cause of the Great Recession of 2008-9.
Jim first says that “I do not think that Roberts’ data about US profit rates actually support some of the conclusions he draws about trends over the past 20 years”. He hints that, when I say there has been a secular decline in the US rate of profit in the post-war period, I might be misleading readers into thinking that this has been“a continuous fall”, when instead there have been “two periods of recovery” with the rise after 2000 being“the most significant”. Well, I have to plead not guilty here. Nowhere, I have stated or implied in any of my papers or work that there was a ‘continuous fall’ in the US ROP. On the contrary, I have made much of the recovery in profitability since the early 1980s as revealing the impact of the counteracting factors that Marx outlined in his law of profitability. So this is a straw man on Jim’s part to knock down.
There has been a secular fall and, as Jim says, “this is clearly correct”. But as Jim says, “Michael Roberts’ own empirical work makes evident, there has not been, over the past 20 years, a simple linear fall in the US rate of profit. Rather what we see are cyclical patterns of oscillation. Falling rate of profit tendencies are battling it out against counter-tendencies”.
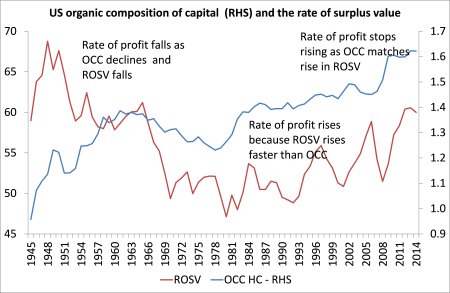
Another red herring, in my view, is Jim’s claim that I reckon changes in the organic composition of capital cause changes in the short-term business cycle. As Jim says, “Marx himself saw the organic composition of capital as changing over longer periods of time, not as the cause of short-run movements in the business cycle.” I agree. And I don’t think that I have argued that it explains ‘short-term’ movements. But it is essential to explaining why the rate of profit will fall over time, namely because of a rise in the organic composition of capital, unless counteracting factors (like a faster rise in the rate of surplus value) dominate. Indeed, this explains the movement in the US rate of profit in the post-war period.
The organic composition of capital rises secularly but with a fall from the mid-1960s to the end of the 1970s. It rises in the neo-liberal period from the early 1980s, but the rate of exploitation rises faster. In the 2000s, the rise in the organic composition accelerates to match the rise in the rate of surplus value and so the rate of profit stops rising.
More specifically, Jim reckons that I cannot draw the conclusions from my own data that: 1) that the US rate of profit peaked in 1997 and has been static or falling since then: 2) the US rate of profit started to fall again from 2010 or 2012 (depending on the measure used): and 3) the fall in the rate of profit has now given way to a fall in the mass of profits. Instead Jim reckons that my data show no such fall after 1997 and indeed the rate was higher in 2007 and “profitability fell in 2008 and after as a result of the financial crisis rather than as its cause”.
Well, two things here. Jim uses the Kliman measure of the rate of profit in his Figure 2. That does show a rise in the rate of profit from a low in 2001 to a high in 2006 that is higher than in 1997. But there is a clear fall from 2006, a good two years before the Great Recession began in 2008. So, even on these data, the rate of profit did not fall “after” the financial crisis but before.
Annual figures for the rate of profit are not very helpful on the timing here. In my original work that Jim is quoting from, I also used the quarterly figures provided by the US Federal Reserve Bank. The Fed data can give us the non-financial corporate sector rate of profit by the quarter. According to that data, the US NFC rate of profit started falling in Q3-2006. Indeed, by the time of the credit crunch in mid-2007 (before the start of the Great Recession, the NFC ROP had fallen 20%). Interestingly, the Fed data also show that the NFC rate of profit at that time was well below the peak reached in 1997 (10% lower). It is currently more than 10% below 2006.
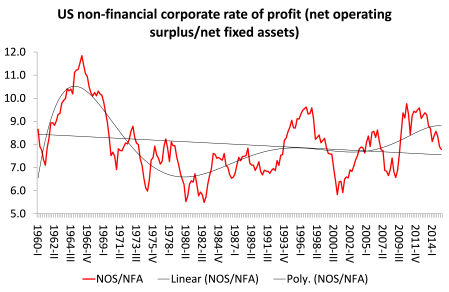
Jim says my data show a fall in the US ROP only in 2015, so my claim of a fall earlier is incorrect. Well, as Jim says, on the annual measures, the peak in ROP since the end of the Great Recession was in 2014, not 2012, although the difference here is tiny. And in 2015, the ROP fell. But if we look at the Fed’s quarterly data, we find that the peak was as early as Q3 2010 and is now some 20% below that peak.
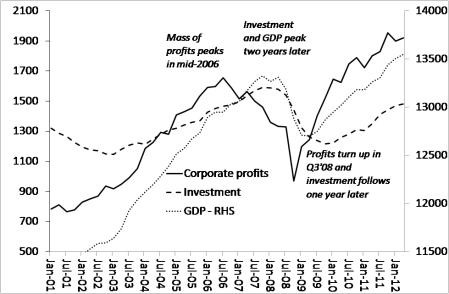
Now Jim says that I argue that a fall in the rate of profit is “normally followed by a rise in the mass of profit which is only a temporary phase”. He then measures the mass of profit against gross domestic income (his Figure 3) which shows that the mass of profit has risen ‘permanently’ up to 2015. Well, I don’t think Jim has properly presented what I do say. What I argue,a la Marx, is that a fall in the rate of profit will eventually affect the mass of profit and lead to its fall – and this is usually a key indicator of a subsequent fall in business investment and a slump in capitalist production. Indeed, this is the cyclical process of a recession.
We can see the process leading up to the Great Recession in this graph of US business profits, investment and GDP.
The point that I am making is that the mass of profit will only start falling after the rate of profit has begun to decline. If the US rate of profit started falling, say in 2012, or at least stopped rising, then we can expect the mass of profit to do so later. Indeed, as Jim shows with his profit margin figure (profits as share of GDI), that happened in 2015. This suggests that a fall in US business investment will follow and eventually bring a new slump in GDP. Indeed, US business investment has been falling for five quarters.
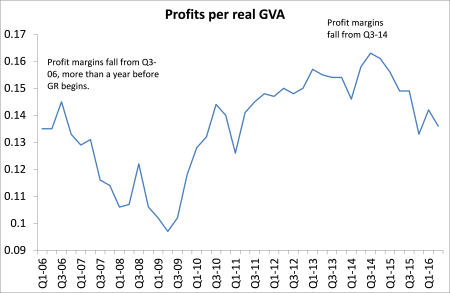
We can get quarterly figures for profit margins in the non-financial corporate sector (profits as a share of real gross value added) from the BEA NIPA. This is what they show in the figure below.
Again, the mass of profit in non-financial corporations began to fall well before the credit crunch of 2007 and the Great Recession of 2008-9. Then it recovered hugely before peaking in fall 2014 (earlier than 2015 on the annual data provided by Jim). Profit margins are now back to 2006 levels.
Now, as Jim makes clear, the purpose of his critique of my data and conclusions on the US rate of profit is to “support to the broader argument I have been developing that in this period the system has been contending, not with falling rates of realised profit, but rather with an excess of profit relative to the levels of investment which have been lagging”.
As Jim says, he has been developing this view of the cause of the Great Recession for a while. I think he presented it back in 2014 at HM. In an abstract then, Jim said that “(1) empirically, the thesis of falling rates of profit in the major economies is based on an uncritical use of not always reliable government data; (2) Harvey and other sceptics are correct to stress that central to the present crisis is the inability of the global system to absorb large quantities of surplus money capital derived from high rates of surplus-value extraction (profits included)”.
Jim argues that it was not, as I argue, a falling rate of profit, or too little profit that caused the Great Recession and subsequent weak recovery, buttoo much. Capitalist firms have built up huge cash reserves from profits that they are not investing productively. So the problem is one of how to ‘absorb’ these surpluses, not how to get enough profit. This also shows, according to Jim, that the causal sequence for crises, is not, as I argue (as above), falling profits leading to falling investment to falling income and employment because we have rising profits and falling investment.
Jim says, that “The operation of these forces has generated a global surplus of capital in the money form which is too large to be recycledback into productive investment. Thus what we have is, not a crisis of Keynesian lack of consumer demand, nor a Monthly Review crisis of monopoly profits. But, instead, a crisis of a particular sort of disproportionality – between available accumulations of money capital and the capacity of the system to absorb them.”
Well, I have to say, despite Jim’s denials, his thesis sounds pretty close to that of Paul Sweezy and Paul Baran of the Monthly Review ‘school’that monopoly capitalism has sunk into stagnation because it cannot dispense with ever-increasing surpluses of profit.
But let us consider this argument. The idea of a global savings glut has become popular among mainstream economics, both monetarist like Ben Bernanke, the former US Fed chief and Keynesian like Martin Wolf, the FT journalist. Both Wolf and Jim (on his blog) have presented evidence of this corporate savings gap.
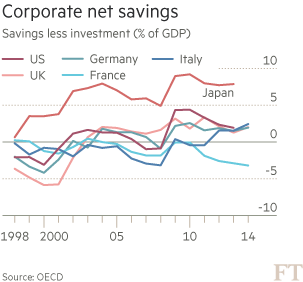
This gap, technically called ‘net lending’ by corporations, Wolf describes as a global ‘savings glut’. The notion of a “savings glut” was first mooted by former Federal Reserve chief, Ben Bernanke, back in 2005. He argued that economies like China, Japan and the oil producers had built up big surpluses on their trade accounts and these ‘excess savings’ flooded into the US to buy US government bonds, so keeping interest rates low.
Martin Wolf and other Keynesians have liked this notion because it suggests that what is wrong with the world economy is that there is too much saving going on, causing a ‘lack of demand’. This is the proposition that Wolf recently pushed in his latest book. In his book, Wolf concludes that the cause of the Great Recession“was a savings glut (or rather investment dearth); global imbalances; rising inequality and correspondingly weak growth of consumption; low real interest rates on safe assets; a search for yield; and fabrication of notionally safe, but relatively high-yielding, financial assets.”
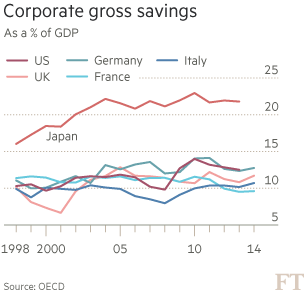
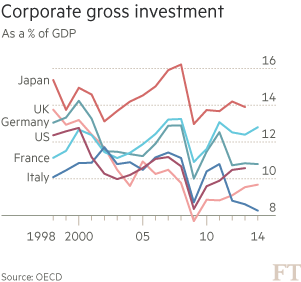
But is the gap between corporate savings and investment caused by a ‘glut of savings’? Well, look at the graph provided by Wolf, taken from the OECD.
With the exception of Japan, since 1998, corporate savings to GDP have been broadly flat. And for Japan, the ratio has been flat since 2004. So the gap between savings and investment cannot have been caused by rising savings. The second graph shows what has happened.
We can see that there has been a fall in the investment to GDP ratio in the major economies, with the exception of Japan, where it has been broadly flat. So the conclusion is clear: there has NOT been a global corporate savings (or profits) ‘glut’ but a dearth of investment. There is not too much profit, but too little investment.
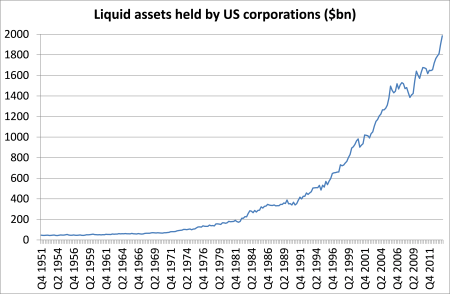
But what about the issue of cash mountains in major non-financial companies? It is true that cash reserves in US companies have reached record levels, at just under $2trn – see graph below. (All figures come from the US Federal Reserve’s flow of funds data.) The rise in cash looks dramatic. But also note that this cash story did not really start until the mid-1990s. In the glorious days of the 1950s and 1960s when profitability was much higher, there was no cash build-up.
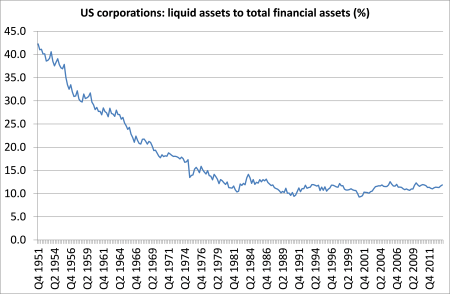
But the graph is misleading. It is just measuring liquid assets (cash and those assets that can be quickly converted into cash). Companies were also expanding all their financial assets (stocks, bonds, insurance etc). When we compare the ratio of liquid assets tototal financial assets, we see a different story.
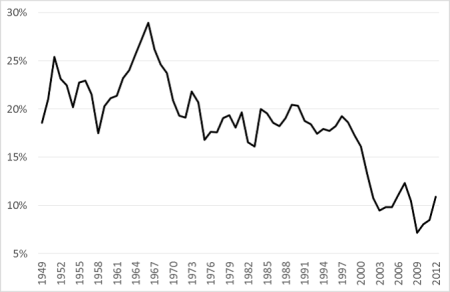
US companies reduced their liquidity ratios in the Golden Age of the 1950s and 1960 to invest more. That stopped in the neoliberal period but there was still no big rise in cash reserves compared to other financial holdings. And that includes the apparent recent burst in cash. The ratio of liquid assets to total financial assets is about the same as it was in the early 1980s. That tells us that corporate profits may have been diverted from real investment into financial assets, but not particularly into cash.
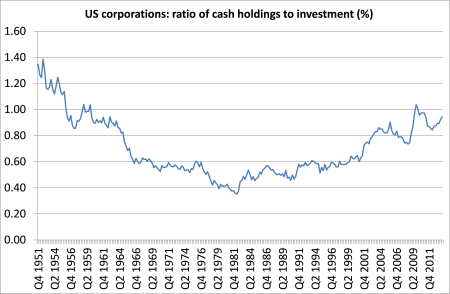
Comparing corporate cash holdings to investment in the real economy, we find that there has been a rise in the ratio of cash to investment. But that ratio is still below where it was at the beginning of the 1950s.
And remember within these aggregate averages lies the reality that just a few mega companies hold most of the cash while thousands of small and medium enterprises (SMEs) hold little cash and much more debt. Indeed, a minority are really ‘zombie’ firms just raising enough profit to service their debt.
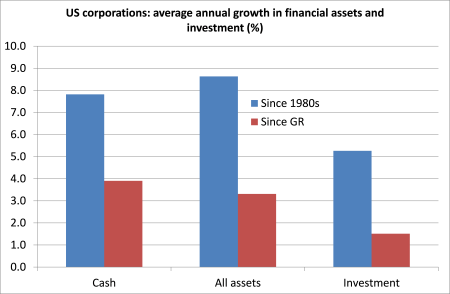
Why does that cash to investment ratio rise after the 1980s? Well, it isnot because of a fast rise in cash holdings but becausethe growth of investment in the real economy slowed in the neoliberal period. The average growth in cash reserves from the 1980s to now has been 7.8% a year, which is actually slower than the growth rate ofall financial assets at 8.6% a year. But business investment has increased at only 5.3% a year in the same period, so the ratio of cash to investment has risen.
Interestingly, if we compare the growth rates since the start of the Great Recession in 2008, we find that corporate cash has risen at a much slower pace (because there ain’t so much cash around!) at 3.9% yoy. That’s slightly faster than the rise in total financial assets at 3.3% yoy. But investment has risen at just 1.5% a year. So consequently, the ratio of investment to cash has slumped from an average of two-thirds since the 1980s to just 40% now.
So companies are not really ‘awash with cash’ any more than they were 30 years ago. What has happened is that US corporations have used more and more of their profits to invest in financial assets rather than in productive investment. Their cash ratios are pretty much unchanged, suggesting that there is not a ‘wall of money’ out there waiting to be invested in the real economy.
This brings me back to the point I left earlier when I showed that the profitability of non-financial corporations did fall after 1997 and remains well below. What that tells me is that after 2000 the corporate profitability measure (Kliman) or the ‘whole economy’ measure (Roberts) express the rise in the profitability of the finance and other unproductive sectors of the US economy, while the productive sector ROP continued to fall. In other words, much of the rise in profitability and profits after 2000 was fictitious. Can I justify that conclusion?
Well, work by Peter Jones in Australia has done just that. Peter Jones argues that “fictitious profits can also hide the consequences of a falling rate of profit for a time. Government borrowing can ‘artificially’ inflate the after-tax rate of profit on production (and the same effect applies to after-tax rates of profit from secondary exploitation); and fictitious profits can ‘artificially’ inflate investors’ wealth and rates of return.”
Jones[i] adjusted the official US figures for profit for fictitious profits, namely those made by banks from lending to government (bond purchases) and from utilising the savings of workers (mortgages etc) to come up with a measure of profit that best represents surplus value created in production and realised by the productive corporate sector. When he puts this against net fixed assets, the result looks like this.
So the post-2000 divergence between corporate profits and capex disappears and can be explained by a rise in investment in financial assets or what Marx called ‘fictitious capital’.
Yes, large firms in the capitalist sector of the major economies have been hoarding more cash rather than investing over the last 20 years or so. But they are not investing so much because profitability is perceived as being too low to justify investment in riskier hi-tech and R&D projects, and because there are better returns to be had in buying shares, taking dividends or even just holding cash.
Also many companies are still burdened by high debt even if the cost of servicing it remains low. The high leveraging of debt by corporations before the crisis started now acts as a disincentive to invest. Corporations have used their cash to pay down debt, buy back their shares and boost share prices, or increase dividends and continue to pay large bonuses (in the financial sector) rather than invest in productive equipment, structures or innovations.
I conclude that the cash reserves of major companies is not an indication that the cause of crises is due to inability to absorb ‘surplus profit’ but due to an unwillingness to invest when profitability remains low and corporate debt is relatively high. That is the cause of this Long Depression.
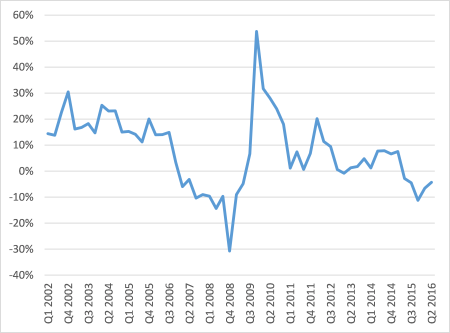
And here is the rub. Just at this time when Jim raises the issue of huge cash reserves and suggests that the cause of crises is due the difficulty of ‘absorbing’ profits, US corporate earnings are falling and profit growth has ground to a halt. Cash reserves are set to fall from here too.
US corporate profits(adjusted for depreciation) % yoy
This brings me to Jim’s final point. Jim questions my “constant theme – that the crucial underlying cause of the crises of the post-2000 period is that the rate of profit peaked in 1997 and has not recovered since.” He says it is“logically questionable” assumption, that if crises are recurrent (even though different in form) there must be a single and common cause. Jim says, the empirical evidence for Marx’s law has“complex results which have to be explained dialectically and not by looking for a single unilinear cause”.
Well, I don’t think it is ‘logically questionable’ to argue that recurrent and regular crises may have a common underlying cause. On the contrary, the regular and re-occurring crises make it logically questionable to look for different causes for each crisis, as many have done, from David Harvey, Panitch and Gindin, Dumenil and Levy etc.
Jim says that the contradictions within capitalism can “change the current configuration of the system. The tendency of profit rates to fall is not in itself a contradiction.” Well, I thought it was“the most important law in political economy” (Marx) precisely because it showed the main contradiction in the capitalist mode of production ie. between developing the productive forces (raising the productivity of labour) and the profitability of capital; between the drive to raise profits for individual capitals and the unintended consequence of falling profitability in the whole system.
The real question is whether the claim that the Marx’s law of profitability as the underlying cause of crises under capitalism can be empirically validated. That is what my work and the work of many others attempts to do. And I think we are achieving that.
[i] Peter Jones, The falling rate of profit explains falling growth, paper for the 12th Australian Society of Heterodox Economists Conference, November 2013
